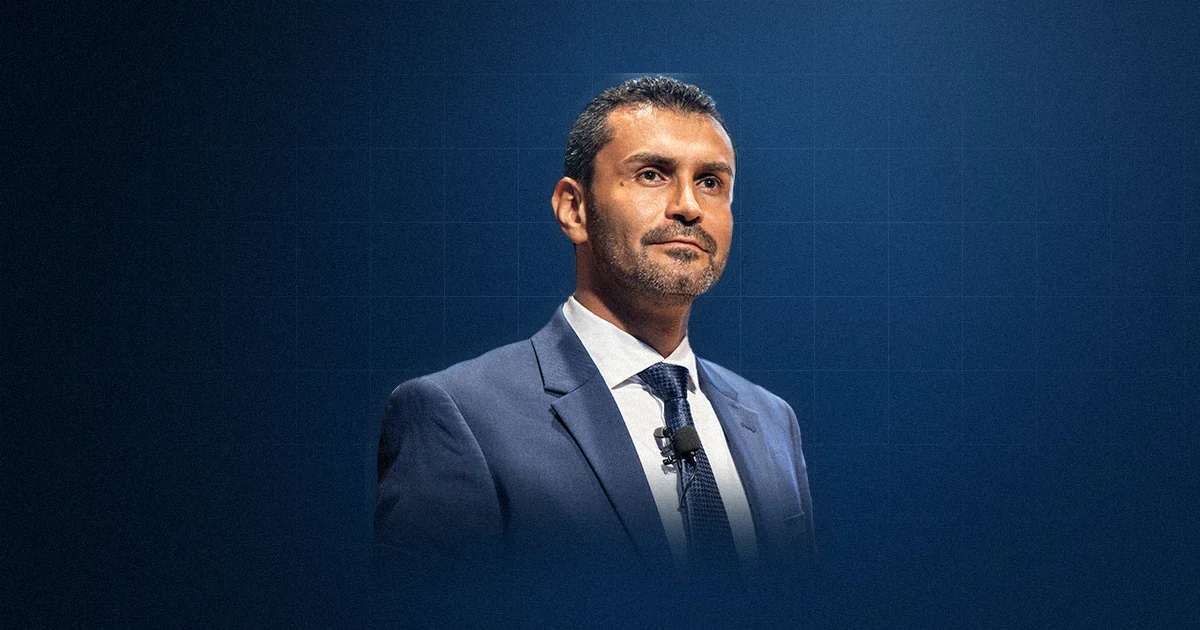
Oscar Bonilla, PhD
Every morning, long before the opening bell rings on Wall Street, professional traders have already been at work for at least an hour. They aren't trading—they're reading. Analyzing. Preparing. Because in the stock market, the line between making money and losing it is almost always decided before executing your first trade.
On Elite One Trading's Wall Street News show, Oscar Bonilla and his analyst team walk through this routine live every trading day. Here is a breakdown of the exact methodology they use so you can replicate it yourself.
Pre-Market: Your Competitive Edge
The US market officially opens at 9:30 AM Eastern Time (ET). But the action starts much earlier. The pre-market session (4:00 AM to 9:30 AM ET) is where pros read the day's signals.
What should you look for in the pre-market?
- Index Futures: The S&P 500 (SPY), NASDAQ (QQQ), and Dow Jones are already moving. If all three point in the same direction, market sentiment is clear. If they're mixed, expect higher volatility
- Crude Oil Prices: WTI and Brent. Sharp moves in oil directly impact airlines, shipping, energy, and ultimately, inflation
- Dollar Index (DXY): A strong dollar generally puts pressure on stocks, while a weak dollar supports them
- VIX (Volatility Index): Below 15 = calm market. Between 15 and 25 = normal volatility. Above 25 = exercise caution
The 5 Catalysts That Move the Market
A catalyst is any event powerful enough to significantly move a stock price or the broader market. Oscar teaches traders to categorize them into five groups:
1. Earnings Reports
Four times a year, public companies report their financial results. The key metrics to watch are:
- EPS (Earnings Per Share): Net income per share. Beating analyst estimates is generally positive
- Revenue: Total top-line sales. Year-over-year growth is what matters most
- Guidance: What the company projects for upcoming quarters. This is often far more important than current-quarter numbers
Investors care about what is going to happen to their money in the future, not just what already happened.
— Oscar Bonilla, PhD
2. Federal Reserve (Fed) Decisions
The Fed meets roughly every six weeks to set interest rates. Higher rates make credit more expensive and pressure stocks, while lower rates stimulate investment. But the rate decision itself isn't the only driver—the subsequent press conference by the Fed Chair provides crucial clues about future policy.
3. Macroeconomic Data
The most important economic indicators for traders:
- GDP: Overall health of the economy
- PCE (Personal Consumption Expenditures): The Fed's preferred inflation gauge
- Non-Farm Payrolls (NFP): Job creation numbers. Released on the first Friday of every month, driving high market volatility
- CPI (Consumer Price Index): Consumer-level inflation measurement
4. Geopolitical Events
Conflicts, trade deals, sanctions. In 2026, tensions between the United States and Iran showed how a single geopolitical event can move crude oil 15% in a single week and drag down the entire market. Professional traders don't ignore headline risk—they factor it directly into their risk management.
5. Tech Sector Movements
The top 10 companies in the S&P 500 represent roughly 40% of the entire index. When Microsoft, Apple, Google, Amazon, Meta, or NVIDIA report earnings, the whole market moves. Trading while ignoring the "Magnificent" tech giants' earnings is like trading blindfolded.
Essential Technical Indicators
Oscar's team relies on a core set of technical tools available on almost any trading platform:
- Moving Averages (8, 20, 200 periods): When all three trend upward and price sits above them, the trend is bullish. When they cross downward, it's a caution signal
- VWAP (Volume Weighted Average Price): The intraday benchmark. If price trades above VWAP, buyers are in control; below VWAP, sellers dominate
- Bollinger Bands: Measure volatility squeeze and expansion. When bands contract, a big move is coming; when they expand, the move is already underway
- Volume: A rally without volume is suspicious. A move backed by rising volume carries real conviction
If we see the volume trend shift and sustained volume coming in, we're likely looking at a stronger, more sustainable market with much higher conviction.
— Oscar Bonilla, PhD
The Fear & Greed Index: The Market's Emotional Thermometer
CNN publishes the daily Fear & Greed Index, a composite indicator measuring market sentiment on a scale from 0 (Extreme Fear) to 100 (Extreme Greed).
Warren Buffett famously summarized this mindset: "Be fearful when others are greedy, and greedy when others are fearful." The Fear & Greed Index gives you a quantifiable reading on when each scenario applies.
The Professional Trader's Pre-Session Checklist
Run through this checklist before every single session:
- Where are futures pointing? (bullish / bearish / sideways)
- Are there key economic releases today? (Fed, GDP, NFP, CPI)
- Which companies report earnings today?
- Are there major geopolitical headlines?
- Where is the VIX reading? (calm / elevated / extreme)
- What are today's key technical levels? (support and resistance)
- What is my maximum risk limit today? (no more than 2% per trade)
If you can't answer at least 5 out of these 7 questions, you're not ready to trade. And that's okay. Sitting on your hands is infinitely better than taking unprepared trades.
What NOT to Do
- Trading social media hype: By the time a "hot tip" hits X or TikTok, the move has already happened
- Ignoring the economic calendar: Trading on a Fed decision day without realizing it is like crossing a highway blindfolded
- Confusing pre-market with regular hours: Pre-market moves can completely reverse within the first 15 minutes of the open
- Trading without defined levels: If you don't know your entry, price target, and stop-loss before entering, you don't have a plan—you have a gamble
The market opens every single day. If you don't have absolute clarity today, close your platform and come back tomorrow fully prepared.
— Oscar Bonilla, PhD
This article is based on the methodology taught on Elite One Trading's Wall Street News show, broadcast live every trading day by Oscar Bonilla, PhD, and his team of analysts. All indicators and tools mentioned are publicly accessible.